
How To Quantify Comfort with PMV
Have you ever wondered how the software we use decides what a “comfortable” building is? It seems like a very subjective matter for engineers to mathematically calculate. In particular, we have to make sure the method of quantifying human comfort is carefully considered and that the numbers align with reality.
We all experience the world differently, and no one solution will fit everyone – I’m sure you know someone that has no problem wearing just a t-shirt & shorts in Winter or someone who still wears a jacket during Summer. This becomes an issue when you’re an Architect or Engineer trying to create a building that will be used by a variety of different people, all with different needs and expectations. It’s a problem for many different aspects of building design, but here we’re just going to address thermal comfort and how we ascertain that a building’s thermal performance will be comfortable for as many people as possible. The method used to calculate human comfort is called the “Predicted Mean Vote”, or PMV, which is derived from ANSI/ASHRAE Standard 55. This refers to the Predicted Mean Vote of the thermal comfort as perceived by the building occupants.
Over many years in different experiments, thousands of people from varied sample groups have been tested at different environmental conditions to “vote” on how they feel. From these experiments, the analysis of trends and correlations have resulted in the PMV calculation formula.
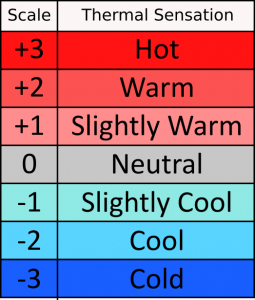
PMV is an index that predicts the mean vote of a large group of people, represented as a 7-point thermal sensation scale.
A PMV between -1 and +1 means a maximum of 26% of people will be dissatisfied. In fact, a perfect PMV of 0.0 still means 5% of people will be dissatisfied, because some people are naturally more extremely “hot blooded” or “cold blooded”.
How does a building comply with the Predicted Mean Vote Requirement?
In NCC2019 Volume 1, in all three Verification Methods JV1, JV2 and JV3, the PMV must be calculated. In the building thermal simulation the PMV is determined for every occupied building zone/room for every single hour for a whole year. A building should have its results listed in a table that clearly says all the occupied zones, the zone floor areas, and the percentage hours of operation that zone has a PMV between -1 and +1.
Each zone is considered within its individual compliance range when the PMV is between -1 and 1 for more than 98% of the occupied hours. Finally, for a Building PMV Compliance “Pass”, the floor area of occupied zones that comply must be not be less than 95% of all occupied zones. If this is all a bit confusing for you, worry not – we’ll be showing you an example table further down below. But before we get there, let’s go through the actual parameters used in the PMV calculation itself.
Parameters affecting Predicted Mean Vote
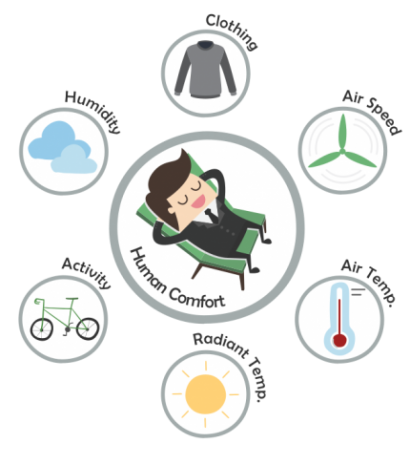 Air Speed (unit: m/s, range: 0 to 2)
The speed of air circulating throughout the building space, in metres per second (m/s). If you want to know more on this, we have a handy article on how ceiling fans work with more information on the effects of air speed on comfort.
Air Temperature (unit: °C, range: 10 to 30)
The internal air temperature in a building space in degrees Celsius. It is measured as “Dry Bulb Temperature”, which is the measurement of true thermal air temperature, without influence from humidity or direct sunlight or reflected ambient radiant surfaces.
Mean Radiant Temperature (unit: °C, range: 10 to 40)
The average amount of heat that is radiated into the building from surfaces such as ceilings, windows and walls. This is most often heat that is absorbed and re-radiated by the building fabric into the living spaces.
Relative Humidity (unit: %, range: 0 to 100)
This refers to how much moisture vapour is in the air, expressed as a percentage of the maximum amount of moisture the air can hold at the current temperature, before it is released as condensation or precipitation. That is, the Absolute Humidity (grams per meter cubed (g/m³) of moisture) divided by the Saturation Humidity (e.g. 30g/m³ at 30 degrees Celsius), multiplied by 100 to give the Relative Humidity percentage (%).
Activity (unit: met, range: 0.8 to 4.0)
Activity rate combines two factors: metabolic rate and external work. Metabolic rate is the rate at which energy is produced by the body. External work is the amount of activity being performed by a person, therefore knowing the expected use of a building is important to find the correct activity rate. For instance, 1 metabolic unit (1 met) is about normal for an active seated person in an office. 1.5 met is typical for a standing person.
Clothing (unit: clo, range: 0 to 3)
The amount and type of clothing as well as the ratio of exposed/unexposed skin areas. This affects the rate of heat loss by the body. For example, 0.25 clo would be a T-shirt, shorts, shoes and socks, and 1.0 clo would be a light business suit with shoes and socks. For comparison, 1.0 clo is the value used in NatHERS Home Energy Efficiency assessments.
Using Predicted Mean Vote to determine human thermal comfort
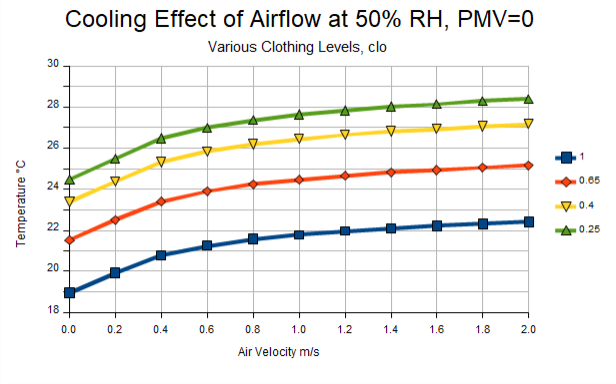 It’s about time for a graph! What would be the air temperature needed to achieve equivalent human thermal comfort with varying air speed and clothing values? Lets use:
- PMV locked at 0.0, representing the mean of the population
- Air Speed on the x-axis of the graph
- Air Temperature on the y-axis of the graph
- Radiant Temperature equal to the Air Temperature (the building’s walls/ceilings are the same temperature as the ambient air)
- 50% Relative Humidity
- Activity Rate set to 1.5 met (a standing person)
- Over four levels of clothing: 1.0, 0.65, 0.4 and 0.25 clo
The result is a series of four nearly parallel curves, with each coloured curve for different levels of clothing. This quantifies the well-known effect of increasing airflow from breezes allowing satisfactory comfort at higher air temperatures. As expected, with more clothing the air temperature needs to be reduced for equivalent human thermal comfort. Interestingly, the curves also show the cooling effect airspeed has on comfort perception as the temperature increases.
The air temperature tolerance is increased by 3.5°C for 1.0 clo by increasing Airflow from still air to 2.0 m/s. This means there’s a certain degree of substitution possible between Clothing and Air Speed. So, when it’s not possible to vary Clothing greatly, Air Velocity can produce most of the desired cooling effect for the same level of thermal comfort… Or in other words, a ceiling fan can make up for situations where you have to wear warmer “smart” business clothing!
Less Clothing improves the tolerance to higher temperatures, but with diminishing effectiveness. For example in still air:
- reducing from 1.0 clo to 0.65 clo (35% less) allows 2.6°C increase
- a further reduction to 0.4 clo (~38% lower) allows a further 1.9°C increase
- and a final reduction to 0.25 clo (~38% lower) allows another increase of 1.1°C in air Temperature
The curves would be similar in shape at other Relative Humidity and Activity Rates with a shift in temperature. Higher Relative Humidity and Activity reduces the Air Temperature for equivalent human thermal comfort.
What my Assessment Report should include
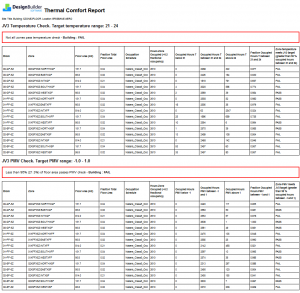 Finally, the actual paperwork part. Your Building Energy Efficiency Assessor must use software that automatically calculates PMV over the simulation year. Therefore, depending on the software used, this should produce a Thermal Comfort Report similar to below (though the Compliance Report should show “PASS”). Knowing how to use the software correctly is of course a requirement, but that’s a complex topic far beyond a couple paragraphs at the end of a related article. Because of this, we recommend using only accredited, certified Assessors.
A table similar to the one shown is needed to confirm Building PMV Compliance. Otherwise, the Energy Efficiency Certification is incomplete as the calculation has not demonstrated compliance with the PMV requirement. In this case, we suggest you return your Energy Efficiency Report to the Assessor for amendment to include all the necessary data. It should go without saying, but all of our Energy Efficiency Reports that require Building PMV Compliance come with a table listing the specific results of your building.
Contact us for a Free Fee Proposal for your next Project!